



Some oscilloscopes allow you to save oscillograms in a built-in memory module with subsequent printing of the results or transferring them to a personal computer drive in stationary conditions.
The oscilloscope allows you to observe periodic signals and measure voltage, frequency, width (duration) rectangular pulses, as well as slowly changing voltage levels.
The oscilloscope can be used for:
- Detection of unstable failures.
- Checking the results of the corrections made.
- Monitoring the activity of the lambda probe of the engine control system equipped with a catalytic converter.
- Analysis of the signals generated by the lambda probe, the deviation of the parameters of which from the norm is an unconditional evidence of a malfunction of the control system as a whole; on the other hand, the correctness of the shape of the pulses generated by the lambda probe can serve as a reliable guarantee of the absence of malfunctions in the control system.
The reliability and ease of use of modern oscilloscopes do not require any special knowledge or experience from the operator. Interpretation of the information obtained can be easily done by means of an elementary visual comparison of the oscillograms taken during the test with the typical time dependencies for various sensors and actuators of automobile control systems given below.
Parameters of periodic signals
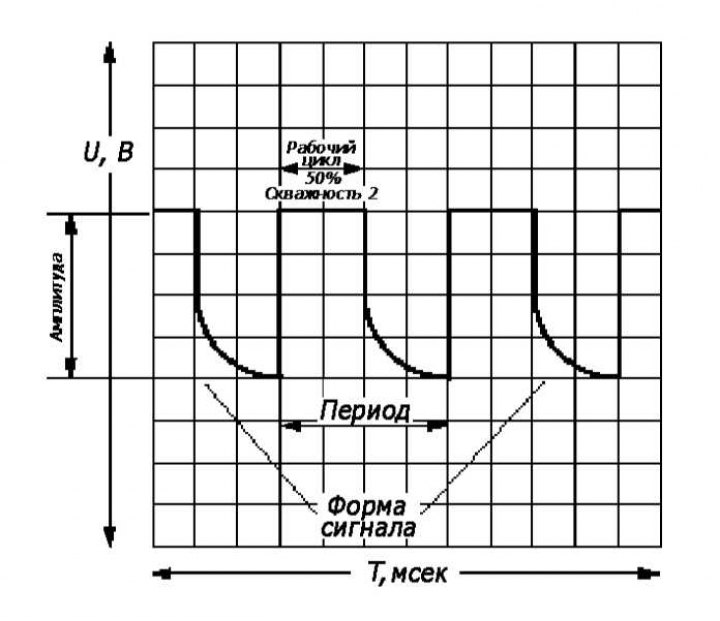
Characteristics of an arbitrary periodic signal
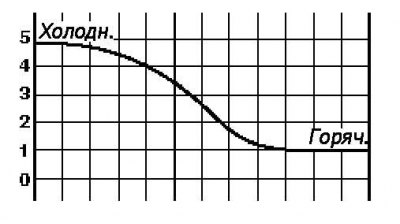
Engine Coolant Temperature (ECT) Sensor
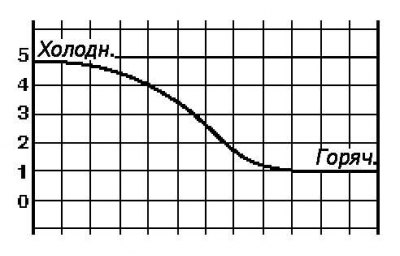
Intake Air Temperature (IAT) Sensor
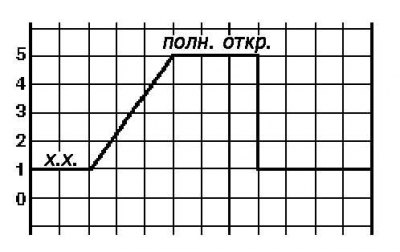
Throttle Position Sensor (TPS)
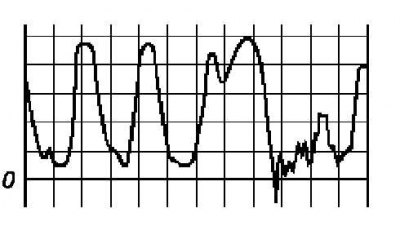
Heated λ-probe (oxygen sensor)
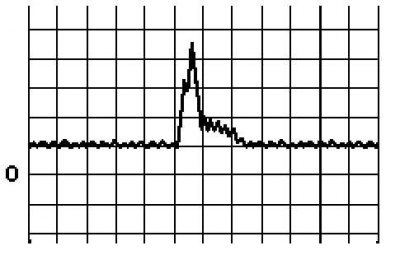
Volumetric Air Flow (VAF) Meter
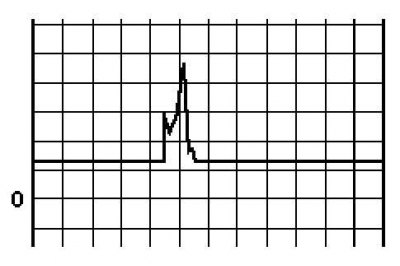
Mass Air Flow (MAF) Meter
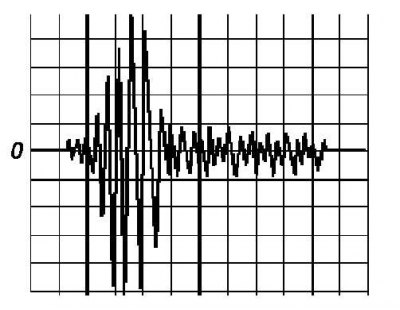
Knock Sensor (KS)
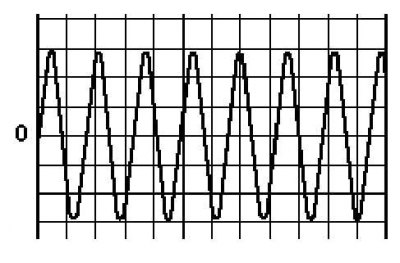
Inductive engine speed sensor
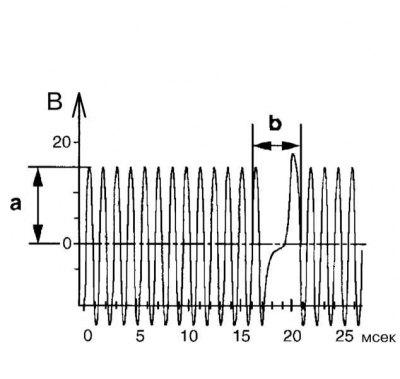
Inductive sensor 15 crankshaft position (CKP)
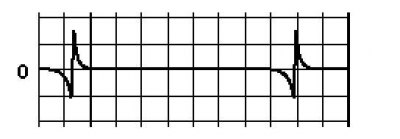
Inductive sensor L5 camshaft position (CMP)
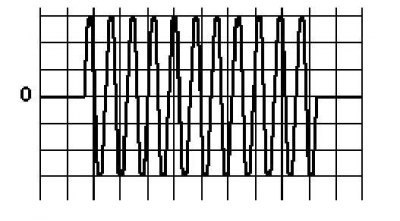
Inductive Vehicle Speed Sensor (VSS)
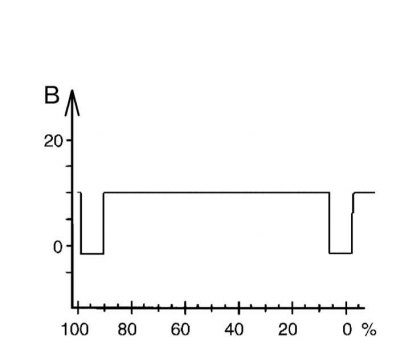
Hall effect speed and shaft position sensors (B6/1)
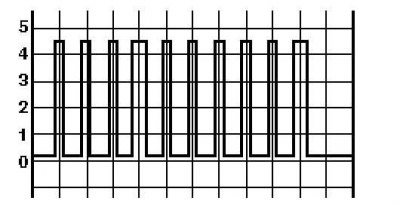
Optical speed and shaft position sensors
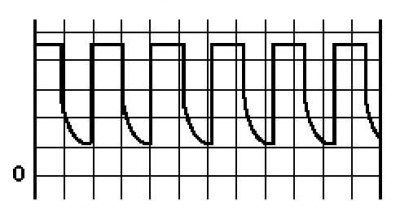
Digital sensors for thermometric measurement of air mass (MAF) and absolute pressure in the intake manifold (MAP)
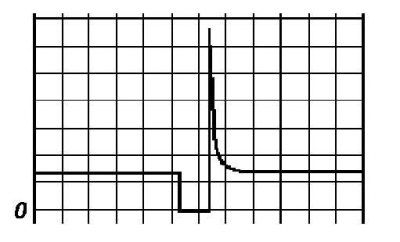
Fuel injectors
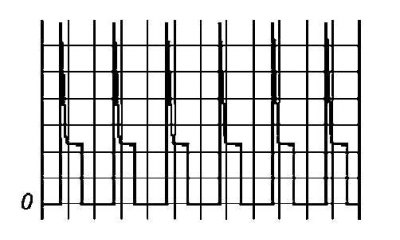
Idle Speed Control (IAC) Devices
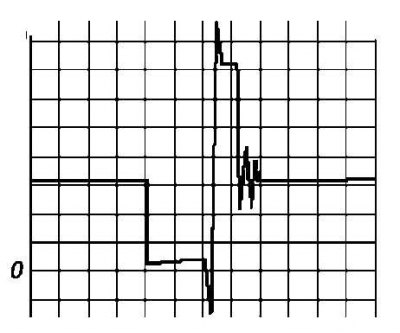
Primary winding of the ignition coil
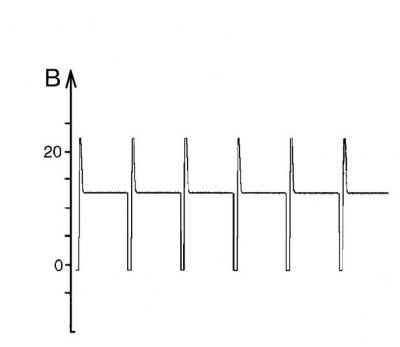
Evaporative Emissions Canister Purge Solenoid Valve Y58/1 (EVAP)
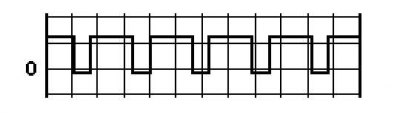
Exhaust Gas Recirculation (EGR) Valves
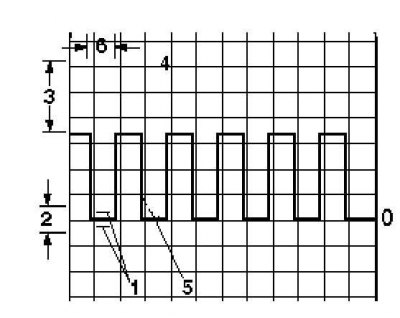
Digital signal
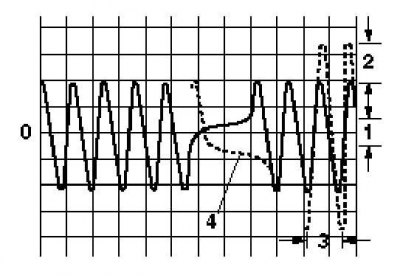
Analog signal
RPM signal (TN)
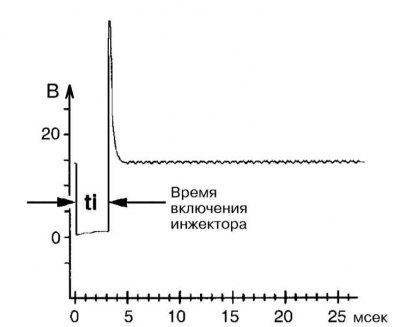
Injector control pulse. Closed throttle valve
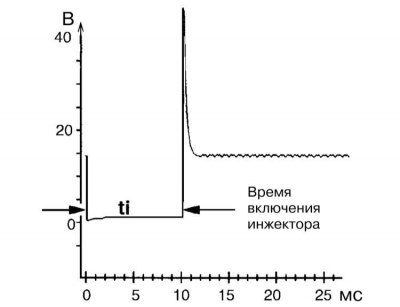
Injector control pulse. Throttle valve fully open
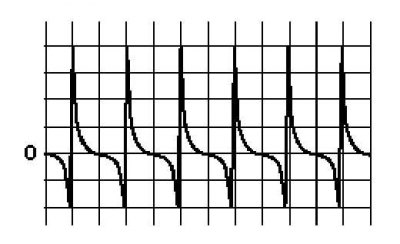
Typical oscillogram of a signal generated by an inductive sensor
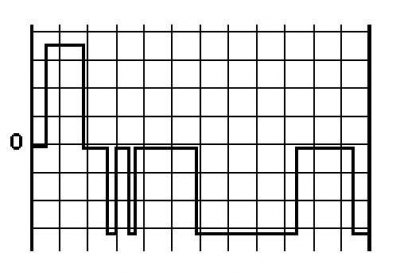
Oscillogram of the control signal of the idle speed control system (IAC)
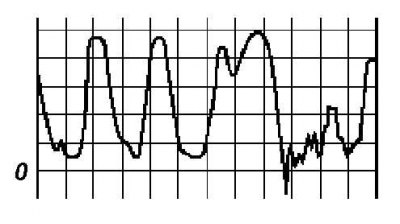
Oscillogram of the signal emitted by a typical lambda probe (oxygen sensor)
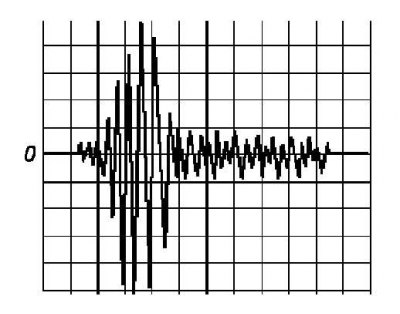
Oscillogram of the signal emitted by a typical knock sensor (KS)
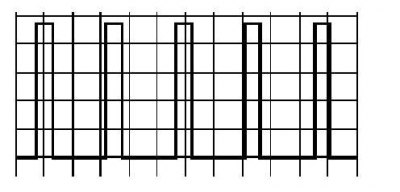
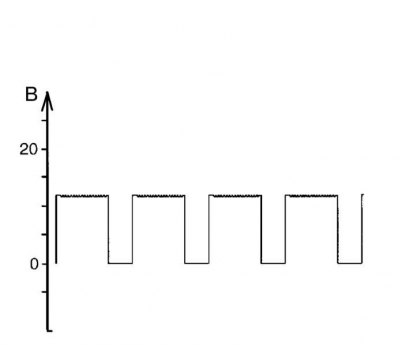
Oscillogram of the ignition amplifier control signal
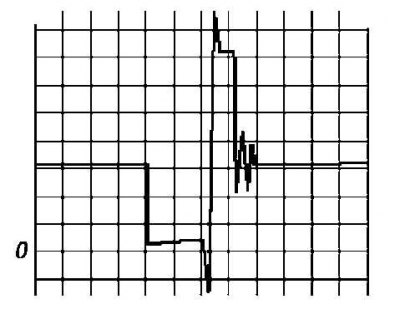
Oscillogram of the signal at the terminal of the primary winding of the ignition coil
Each signal recorded by an oscilloscope can be described using the following basic parameters:
- Amplitude: The difference between the maximum and minimum voltages (V) of a signal within a period;
- Period: Duration of signal cycle (ms)
- Frequency: Number of cycles per second (Hz);
- Width: Duration of rectangular pulse (ms, μs);
- Duty cycle: The ratio of the repetition period to the width (In foreign terminology, the inverse of the duty cycle is used, called the working cycle, expressed in %);
- Signal shape: Rectangular pulse train, spike, sine wave, sawtooth pulse, etc.
Typically, the characteristics of a faulty device differ significantly from the reference ones, which allows the operator to easily and quickly visually identify the failed component.
DC signals - only the signal voltage is analyzed.
AC signals - amplitude, frequency and waveform are analyzed.
Frequency-modulated signals - the amplitude, frequency, signal shape and width of periodic pulses are analyzed. The sources of such signals are devices.
Inductive sensor 15 crankshaft position (CKP) b – recognition of cylinder No.1 (2 teeth missing)
Pulse width modulated (PWM) signals - the amplitude, frequency, signal shape and duty cycle of periodic pulses are analyzed. The sources of such signals are devices.
The shape of the signal produced by the oscilloscope depends on many different factors and can change significantly. In view of the above, before proceeding to replace the suspected component in case of a discrepancy between the shape of the removed diagnostic signal and the reference oscillogram, the obtained result should be carefully analyzed:
Voltage
The zero level of the reference signal cannot be considered as an absolute reference value - the "zero" of the real signal, depending on the specific parameters of the circuit being tested, may be shifted relative to the reference within a certain acceptable range.
The full amplitude of the signal depends on the supply voltage of the circuit being tested and can also vary relative to the reference value within certain limits.
In DC circuits, the signal amplitude is limited by the supply voltage. An example is the Idle Speed Control (IAC) circuit, whose signal voltage does not change with engine speed.
In AC circuits, the signal amplitude is already clearly dependent on the operating frequency of the signal source, so the amplitude of the signal generated by the crankshaft position sensor (CKP) will increase with increasing engine speed.
In view of the above, if the amplitude of the signal recorded using the oscilloscope is excessively low or high (up to the cutting of the upper levels), it is enough to simply switch the operating range of the device by moving to the corresponding measurement scale.
When checking the equipment of electromagnetically controlled circuits (e.g. IAC system) when the power is turned off, voltage surges may be observed, which can be safely ignored when analyzing the measurement results.
There is also no need to worry about the appearance of such oscillogram deformations as the flattening of the lower part of the leading edge of rectangular pulses, unless, of course, the very fact of the flattening of the front is not a sign of a malfunction of the component being tested.
Frequency
The repetition rate of signal pulses depends on the operating frequency of the signal source.
The shape of the signal being recorded can be edited and brought to a form convenient for analysis by switching the image time base scale on the oscilloscope.
When observing signals in AC circuits, the time base of the oscilloscope depends on the frequency of the signal source, which is determined by the engine speed.
As mentioned above, to make the signal more readable, it is enough to switch the time base scale of the oscilloscope.
In some cases, characteristic changes in the signal turn out to be mirror-imaged relative to the reference dependencies, which is explained by the reversibility of the polarity of the connection of the corresponding element and, in the absence of a prohibition on changing the polarity of the connection, can be ignored during analysis.
Typical signals of engine management system components
Modern oscilloscopes are usually equipped with only two signal wires, along with a set of various probes, allowing you to connect the device to almost any device.
The red wire is connected to the positive pole of the oscilloscope and is usually connected to the terminal of the electronic control module (ECM). The black wire should be connected to a securely grounded point (ground).
Injectors
The composition of the air-fuel mixture in modern automotive electronic fuel injection systems is controlled by timely adjustment of the opening duration of the electromagnetic valves of the injectors.
The duration of the injectors' open state is determined by the duration of the electrical pulses generated by the control module and fed to the input of the electromagnetic valves. The pulse duration is measured in milliseconds and usually does not exceed the range of 1÷14 ms.
A typical oscillogram of the pulse controlling the injector operation is shown in Fig. 1. Often, a series of short pulsations can also be observed on the oscillogram, following immediately after the initiating negative rectangular pulse and maintaining the electromagnetic valve of the injector in the open state, as well as a sharp positive voltage surge accompanying the moment of valve closing.
The correct functioning of the ECM can be easily checked using an oscilloscope by visually observing changes in the shape of the control signal when varying the operating parameters of the engine. Thus, the duration of pulses when turning the engine at idle speed should be slightly higher than when the unit is running at low speeds. An increase in engine speed should be accompanied by a corresponding increase in the time the injectors remain open. This dependence is especially evident when opening the throttle valve by short presses on the gas pedal.
Using the thin probe from the kit supplied with the oscilloscope, connect the red lead of the device to the injector terminal of the ECM of the engine management system. Securely ground the probe of the second signal lead (black) of the oscilloscope.
Analyze the shape of the signal read while the engine is cranking.
After starting the engine, check the shape of the control signal at idle speed.
By sharply pressing the gas pedal, raise the engine speed to 3000 rpm - the duration of the control pulses at the moment of acceleration should increase noticeably, with subsequent stabilization at a level equal to, or slightly less than, the idle speed.
Rapid closing of the throttle valve should result in a straightening of the oscillogram, confirming the fact of overlapping of the injectors (for systems with fuel shut-off).
During a cold start, the engine requires some enrichment of the air-fuel mixture, which is ensured by an automatic increase in the duration of the injector opening. As it warms up, the duration of the control pulses on the oscillogram should continuously decrease, gradually approaching the value typical for idle speed.
In injection systems that do not use a cold start injector, additional control pulses are used during a cold start of the engine, which appear on the oscillogram as pulsations of variable length.
The table below shows a typical dependence of the duration of the control pulses for opening the injectors on the operating state of the engine.
| Engine condition | Control pulse duration, ms |
| Idle speed | 1,5÷5 |
| 2000÷3000 rpm | 1,1÷3,5 |
| Full throttle | 8,2÷3,5 |
Inductive sensors
Start the engine and compare the oscillogram taken from the output of the inductive sensor with the reference one shown in Fig. 27.
An increase in engine speed should be accompanied by an increase in the amplitude of the pulse signal generated by the sensor.
Idle Speed Control Solenoid Valve (IAC)
In the automotive industry, IAC solenoid valves of many different types are used, also producing signals of different shapes.
A common distinguishing feature of all valves is the fact that the signal duty cycle must decrease with increasing engine load associated with the inclusion of additional power consumers, causing a decrease in idle speed.
If the oscillogram duty cycle changes with increasing load, but when consumers are turned on, there is a violation of the stability of idle speed, check the condition of the solenoid valve circuit, as well as the correctness of the command signal issued by the ECM.
Typically, the idle speed control circuits use a 4-pole stepper motor, which is described below. The 2-pin and 3-pin IAC valves are tested in a similar manner, but the waveforms of the signal voltages they produce are completely different.
The stepper motor, responding to the pulsating control signal issued by the ECM, makes stepwise adjustments to the engine idle speed in accordance with the operating temperature of the coolant and the current engine load.
The control signal levels can be checked using an oscilloscope, the measuring probe of which is connected in turn to each of the four terminals of the stepper motor.
Warm up the engine to normal operating temperature and let it idle.
To increase the load on the engine, turn on the headlights, air conditioner, or - on models with power steering - turn the steering wheel. The idle speed should drop briefly, but then stabilize again due to the operation of the IAC valve.
Compare the captured oscillogram with the reference one shown in Fig. 28.
Lambda probe (oxygen sensor)
Note. The Section contains oscillograms typical for the most commonly used zirconium-type oxygen sensors in automobiles, which do not use a 0.5 V reference voltage. Recently, titanium sensors have become increasingly popular, with an operating signal range of 0÷5 V, with a high voltage level being generated during lean-mixture combustion and a low voltage level being generated during rich-mixture combustion.
Connect an oscilloscope between the λ probe terminal on the ECM and ground.
Make sure the engine is warmed up to normal operating temperature.
Compare the oscillogram displayed on the meter screen with the reference dependence shown in Fig. 27.
If the signal being read is not wave-like, but is a linear dependence, then, depending on the voltage level, this indicates excessive leanness (0÷0.15 V) or over-enrichment (0.6÷1 V) of the air-fuel mixture.
If a normal wave-like signal occurs at engine idle, try pressing the gas pedal sharply several times - the signal fluctuations should not go beyond the range of 0÷1 V.
An increase in engine speed should be accompanied by an increase in signal amplitude, and a decrease by a decrease.
Knock Sensor (KS)
Connect an oscilloscope between the ECM knock sensor terminal and ground.
Make sure the engine is warmed up to normal operating temperature.
Press the gas pedal sharply and compare the shape of the AC signal being recorded with the reference oscillogram shown in the figure.
If the image is not clear enough, lightly tap the cylinder block in the area where the knock sensor is located.
If it is not possible to obtain an unambiguous signal shape, replace the sensor or check the condition of its circuit wiring.
Ignition signal at the amplifier output
Connect an oscilloscope between the ECM ignition amplifier terminal and ground.
Warm up the engine to normal operating temperature and let it idle.
The oscilloscope should display a sequence of rectangular DC pulses. Compare the shape of the received signal with the reference oscillogram shown in Fig. 31, paying close attention to the coincidence of such parameters as amplitude, frequency, and pulse shape.
As the engine speed increases, the signal frequency should increase in direct proportion.
Primary winding of the ignition coil
Connect an oscilloscope between the ECM ignition coil terminal and ground.
Warm up the engine to normal operating temperature and let it idle.
Compare the shape of the received signal with the reference oscillogram shown in Fig. 31 - positive voltage surges should have a constant amplitude.
Unevenness of the surges can be caused by excessive resistance of the secondary winding, as well as a faulty condition of the high-voltage wire of the coil or spark plug wire.
Signal from sensor B40 temperature/level/quantity of oil
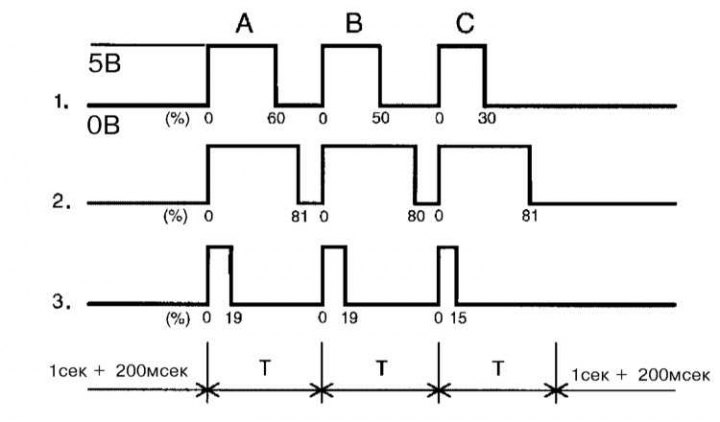
Oscillogram of the signal from the B40 oil temperature/level/quality sensor
1 - Controlled parameters are OK; 2 - Parameters exceeded by more than 80%; A - oil temperature above 160°C; B - oil level above 88 mm; C - the oil quality is good; 3 - Parameters are underestimated by 20%; A - oil temperature below -40°C; B - oil level below 0; C - the oil quality is poor